The process industry (food & beverage, liquids, sheet goods, solid & fluid packaging operations) differs from the parts manufacturing and assembly industry, where the Lean, 6 Sigma and Theory of Constraints methodologies were developed.
A system to manage bottlenecks within manufacturing supply chains was codified in the late 80’s by Dr Eliyahu Goldratt, and introduced to the world when he published his first book called, The Goal, in 1984. This system is known as the Theory of Constraints (TOC).
Applicability to the Process Industry
Goldratt was a physicist and he used his understanding of pure maths and statistics to create a logical approach towards supply chain management that went well beyond his many introductory business novels.
Almost any production operator can grasp the concept of bottleneck although the challenge lies in understanding how manipulating that bottleneck impacts the rest of the supply chain.
The great strength of the Theory of Constraints, and hence the tools shown below, is that it is a prescriptive theory, which means it can tell you not only what’s holding your system back, but also what to do about it and how to do it.
This strength is also an Achilles heel. The Theory of Constraints tools are logical, and they are grounded in a solid statistical, industrial engineering and operations research body of knowledge. This also makes some of the tools too complex and inaccessible for those wanting quick solutions. We have listed the tools below and separated them into 3 categories;
- Applicable – these are tools that are very applicable to the process industry and they have significantly influenced our own tools and techniques
- Enigma – we are still trying to figure out why these tools aren’t used in the process industry (we have tried to introduce them in their original form without success)
- Complex – these tools are VERY correct. We just think that they are far to complex for dissemination throughout any complex production environment, not just the process industry (sorry to our TOC friends).
The List
We have used many references for this list but the most useful resources were Goldratt’s Theory of Constraints by William Dettmer¹ and Manufacturing at Warp Speed by Eli Schragenheim².
| Theory of Constraints Tool | What Is It? | Applicability To The Process Industry |
| Categories of Legitimate Reservation (CLR) | The Categories of Legitimate Reservation (CLR) are the “logical glue” that holds the trees used in the Thinking Process (see below) together. They are eight rules, or tests, of logic that governs the construction and review of the trees. The eight CLR are:
|
Complex |
| Critical Chain Project Management (CCPM) | An elegant interpretation of the Program Evaluation and Review Technique (Pert) and Critical Path Method (CPM) models of project management. CCPM uses operations research techniques to define and manage time buffers.
The technique can also be used to control “A” type plants (see Plant Types below) Used correctly, the technique can dramatically improve project stability and shorten lead times by 20-30%. |
Enigma |
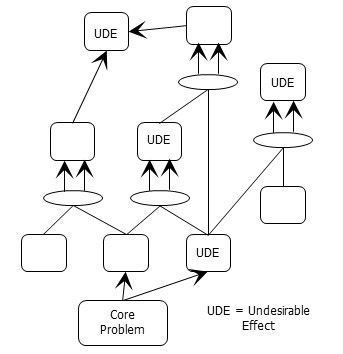
| Current Reality Tree (CRT) | A problem analysis tool used in the Thinking Process (see below). It is used to examine the cause-and-effect logic behind a current situation and in so doing helps to answer the question What to change?
The CRT begins with the undesirable effects we see around us and helps us work back to identify a few root causes, or a single core problem, that originate all the undesirable effects we’re experiencing. The core problem is usually the constraint we’re trying to identify in the Five Focusing Steps (see below).
|
Complex |
| Distribution Solution | The Theory of Constraints Distribution Solution is a multi-echelon method of managing inventories, customer service, and lead times and therefore creating a competitive advantage by maximising the flow of goods to the customer. It includes:
|
Applicable (in fact this solution has been included in the latest edition of Orlicky’s MRP) |
| Drum-Buffer-Rope (DBR) | Drum-Buffer-Rope is a manufacturing execution methodology, named for its three components:
|
Applicable |
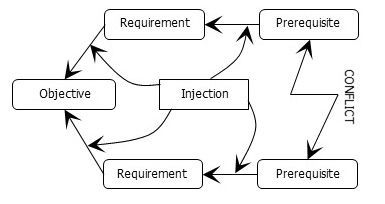
| Evaporating Cloud or Conflict Resolution Diagram (CRD) | Used as a tool in the Thinking Process (see below) as a first step in deciding What to change to? The Future Reality Tree (FRT) is the second step. It recognises that most core problems or root causes are created because of some underlying tug-of-war, or conflict, between two competing and compelling alternatives. It is used to come up with a creative “injection” that resolves the conflict.
|
Complex |
| Five Focusing Steps | The Five Focusing Steps are used to increase the throughput of a system by relieving the system’s constraint and increasing flow. The five steps are:
|
Applicable |
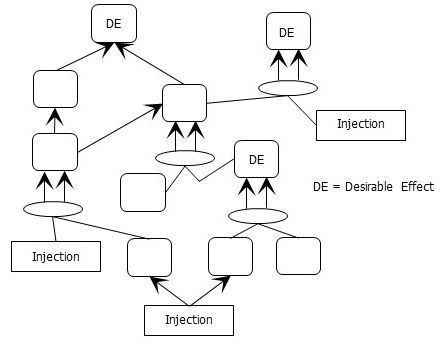
| Future Reality Tree (FRT) | The FRT is part of the Thinking Process (see below) and is a tool used to answer the second part of the question What to change to? The CRD answers the first part.
The FRT is a projection of the future from the starting point of the present. It is constructed from the bottom up, rather from the top down the way a CRT is. It is a logic structure/tree designed to reveal how changes to the status quo would affect reality – specifically to produce desired effects (DE). The FRT also reveals negative branches which are an undesirable or unfavourable development.
|
Complex |
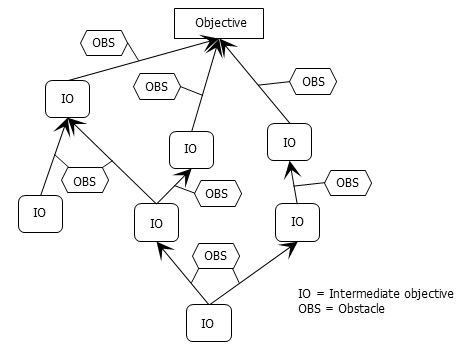
| Prerequisite Tree (PRD) | The PRT is part of the Thinking Process and is a tool used to answer the first half of the last question – How to change? It tells us in what sequence to complete the major milestones in implementing our decision. It also identifies obstacles to what we want to do and the best ways to overcome those obstacles.
|
Complex |
| Plant Types | There are four primary plant types in Theory of Constraints although these types can be combined in many ways in larger facilities:
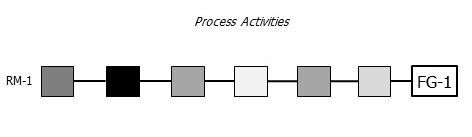
I-plant – Material flows in a sequence and work is completed in a straight sequence of events (one-to-one). There are generally as many inputs as outputs. The capacity is determined by the slowest operation known as the Capacity Constrained Resource (CCR) or Drum.
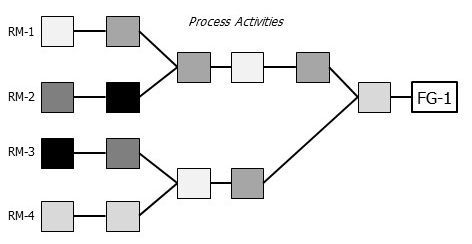
A-plant – The general flow of the plant is many-to-one, such as a plant where many sub-assemblies are converging for a final assembly. The primary problem in A-plants is synchronising the converging lines.
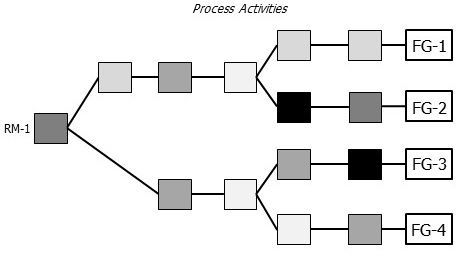
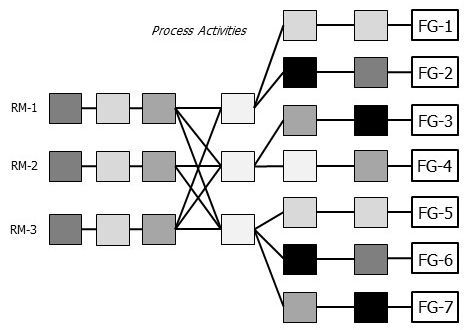
V-plant – The general flow of material is one-to-many, such as a plant that takes one raw material and can make many final products. V-plants are most common in the process industry. Examples are meat rendering plants, rice plants, or steel manufacturers. The biggest issue with V-plants is “robbing” where on operation immediately after a diverging point steals materials meant for a different product or operation.
T-plant – reflects a limited number of components that can be assembled in a wide variety of ways to create a very large number of finished products. T-plants suffer from both the synchronisation problems of A-plants (parts aren’t available at the converging lines) and the robbing problems of V-plants (one assembly steals parts that could have been used in another).
|
Applicable |
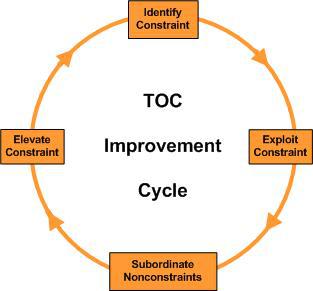
| Process of Ongoing Improvement | The Theory of Constraints (TOC) Process of Ongoing Improvement (POOGI) is similar to Leans PDCA cycle and the 6 Sigma DMAIC cycle.
POOGI for TOC is constraints driven and so incorporates the Five Focusing Steps:
POOGI is a repeating cycle of effort to continuously improve a total system by increasing Throughput and decreasing Inventory and Operating Expense (see Throughput Accounting below). |
Applicable |
| Simplified Drum-Buffer-Rope (S-DBR) | The basic Drum-Buffer-Rope (see above) approach is used throughout a factory to coordinate and sequence several independent workstations.
Sometimes a manufacturing system can be simplified (or at least concentrated) so that there is one Drum in the factory and the total system concentrates on a single Buffer. That single buffer is the buffer (time or stock buffer) between the Drum and the customer. Capacities in the factory are managed so that the constraint for the entire system is always the customer. The Rope is still used to ensure that Work in Progress does not get out of control. This streamlined approach to manufacturing system management is known as Simplified Drum-Buffer-Rope (S-DBR). |
Applicable |
| Thinking Process | The Theory of Constraints (TOC) Thinking Processes are a set of tools that help managers walk through the steps of initiating and implementing a project.
The Thinking Process helps to answer the three basic questions of change:
The theory of constraints tools used to answer these basic questions are (see table entries above and below for more details):
The Thinking Process is used to work through the layers of resistance to change being:
|
Complex |
| Throughput Accounting | Theory of Constraints system relies on a very simple relationship for determining the effect that any local action has on progress towards the system’s goal.
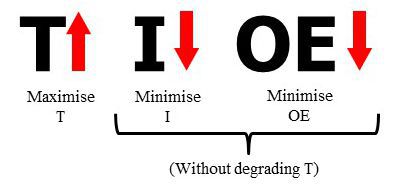
A generally accepted Goal of any business is to: “Make money now and into the future in ways that are consistent with a businesses core values”³ In Theory of Constraints every action is assessed on its effect on system level actions that achieve this goal. There are three system level dimensions used in Theory of Constraints to measure progress towards the goal. They are:
To improve a total system then the priority should be to increase Throughput, while decreasing Investment and Operating Expense. This is counter to the approach taken by most businesses where the normal priority is to cut costs. Throughput Accounting is then a process that alters normal manufacturing accounting procedures so that they align with very clear definitions of T, I and OE. One of its important characteristics is the avoidance of fixed asset allocations or other methods or distributing fixed costs (e.g. unit costing). All activities are then measured by their ability to increase the Throughput of the system as a priority (similar to increasing flow in Lean) and then their ability to reduce Investment and Operating Expenses.
|
Enigma |
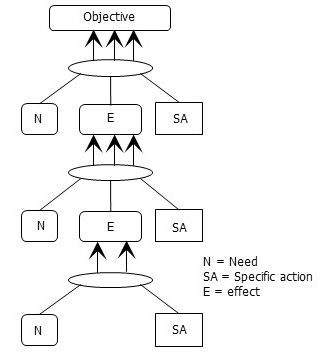
| Transition Tree (TT) | The Transition Tree is the last of the five logical tools used in the Thinking Process (see above). It provides both the steps to take (in sequence) and the rationale for each step.
It is essentially a detailed road map to our objective. It answers the second half of the question, How to change? The Prerequisite Tree answers the first half.
|
Complex |
¹ – Goldratt’s Theory of Constraints, A systems approach to continuous improvement, by H. William Dettmer, ASQC Quality Press, 1997.
² – Manufacturing at Warp Speed, Optimising supply chain financial performance, by Eli Schragenheim and H. William Dettmer, CRC Press, 2001.
³ – Factory Physics, Third Edition, by Wallace J. Hopp and Mark L. Spearman, Waveland Press, Inc. 2008.