Digital twins are simply the digital clone of a system. A digital twin can be a spreadsheet, a CAD drawing, a sophisticated business proposal or a complex dynamic simulation. The common characteristic is that the twin is digital and it accurately depicts the behaviour of a system during the of achievement of a business goal. 

Digital twins are expensive so there are 3 prerequisites that must be satisfied before creating a digital twin in the service of an important business goal.

  • The goal must be worth it
  • The goal must be capable or being modelled
  • The goal must be capable of being monitored

The goal must be worth it

There are 3 parts to defining robust business goals for operations.

- Opportunity

There are plenty of targets, and this is always the case in the process industry. Combine this with the fact that there are less humans in the process industry to do the work, then it’s easy to see why opportunities must be prioritised. 

There are always 3 types of opportunity within a factory as shown above; Crisis Recovery, Capital Projects and Improvements. These opportunities are not made equally, and they must be prioritised.

- Response

The response to any opportunity (above) should support a virtuous circle in which synchronised flow is being maximised, costs optimised and waste minimised (see graphic below).

the ultimate guide to process factory performance

There have been many cases where the number of opportunities has actually increased because of a poor response to a previous opportunity

For example, a buyer tries to minimise (not optimise) buying price by reducing the the quality of raw material inputs (a distortion of what was originally a good opportunity) which causes a reduction in processing machine performance. This increases crewing costs, increases support resources (e.g. maintenance costs) and reduces yield, all together reducing synchronised flow. This increases the number of opportunities in the supply chain as well as causing a net reduction in business performance (reducing ROTA).

Selecting a good response to an opportunity within a complex processing factory is sophisticated. Done well it creates a virtuous circle that exceeds expectations. Selecting a poor response to an opportunity almost always causes a net reduction in business performance and leaves an insidious weakness in the operating system. 

A ranking of a business opportunity should always be measured with a solid understanding of the resources that will be needed to deliver the right response (not the most expedient response).

- Outcome

In the end, the success of a business is measured by Returned On Total Assets (ROTA).

When prioritising opportunities, the final arbiter should be ROTA. The projected ROTA should be assessed while taking into consideration the most effective (not expedient) response.

I can hear the advocates for corporate responsibility (e.g. safety, environment, etc) crying foul here! Perhaps there is an additional measure apart from ROTA or you could just argue for a longer view of ROTA.

The goal must be capable of being modelled

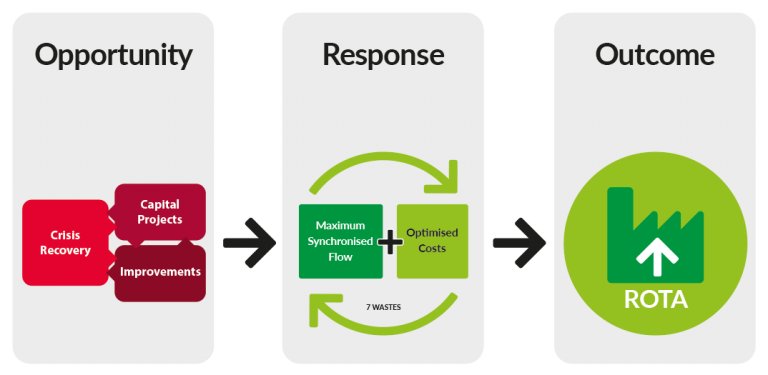
Digital twins are models and for them to add value they must be based on reality and demonstrate the effect of different variables on the goal (above).

Modelling the behaviour of sections within a supply chain, with reference to reality, forces a business to consider what is really happening. 

A model of the current and future state of a system, in today’s high technology world, must take account of 3 important factors;

  • Variability (controlled using buffers)
  • The key variables that effect performance
  • How targets for the future state can be achieved

There are many types of models (digital twins) within a supply chain and I’ve listed some of them below. The key is to know when and how to apply these different modelling techniques within a supply chain.

  • Control panel showing corporate-wide supply chain performance
  • Demand modelling
  • Network modelling (node positioning using linear programming tools)
  • Dynamic transport modelling (using statistical analysis and crew theory to demonstrate the time based behaviour of a transport system)
  • Inventory buffer sizing (using different order and variability control schemes to determine optimum inventory levels)
  • Value stream mapping
  • Factory schedule modelling
  • Dynamic factory modelling

A model is used to define;

  • what is expected to happen now (current state)
  • what is possible into the future (future state)
  • how to get from the current state to the future state

The goal must be capable of being monitored

The key here is that the way a system was modelled (I should say the way it had to be modelled) determines the way it must be monitored

If the monitoring method does not demonstrate the behaviour of the key variables identified in the model then it simply is not suitable. This is why employees often use spreadsheets as a supplement to expensive ERP systems.

A good monitoring system will show how the current performance of a system is deviating from that which was expected in the model. It should;

  • show how buffers inserted into the system (to manage variability) are performing
  • demonstrate progress towards a modelled future state