
Overall Equipment Effectiveness (OEE) is often used as the main metric for factory performance in the process industry (food & beverage, liquids, sheet goods, solid & fluid packaging operations).
However, while OEE is a good measure for independent workstations and processes, production lines in the process industry are usually made up of several workstations and processes which are all connected together, rendering the OEE metric less than ideal.
In this article we describe a better metric that can be used to focus attention on the key leverage points in a processing line and therefore improve the Return On Assets (ROA) for an entire factory.
The OEE metric was made famous by the Lean movement although it originated from the development of Total Productive Maintenance (TPM). TPM evolved from the parts manufacturing and assembly industry in Japan. Its parallel evolution with the Toyota Production System during the 1950’s thru 1960’s makes TPM, and therefore the OEE metric, intimately linked with Lean.
The graphic below shows the buidling blocks of the traditional OEE measure.
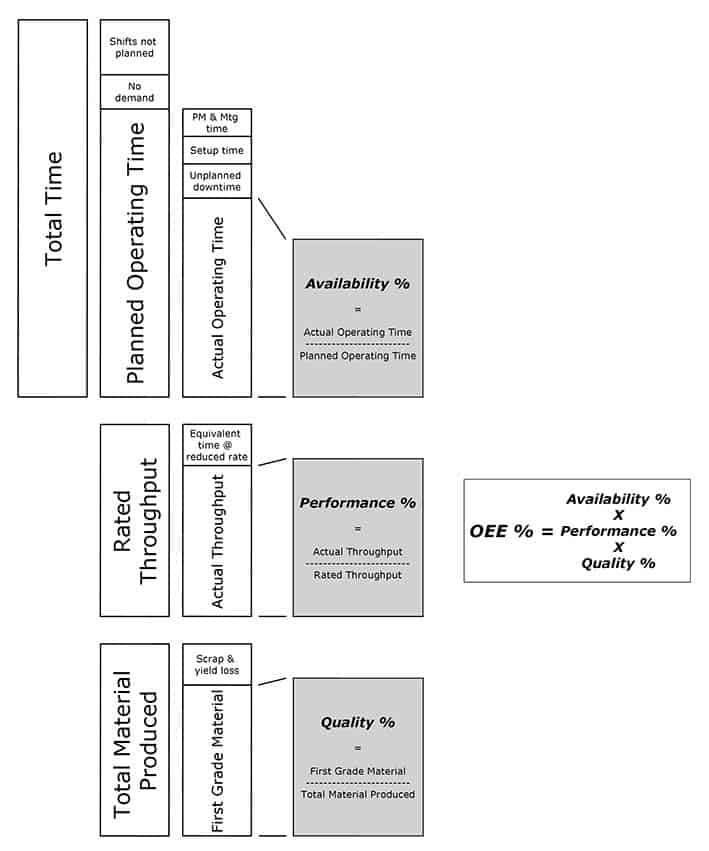
OEE was developed with discrete workstations in mind such as lathes, assembly stations, robot stations, etc. The challenge is to develop the OEE measure so that it can be used for production lines in the process industry that include a series of interconnected workstations or processes.
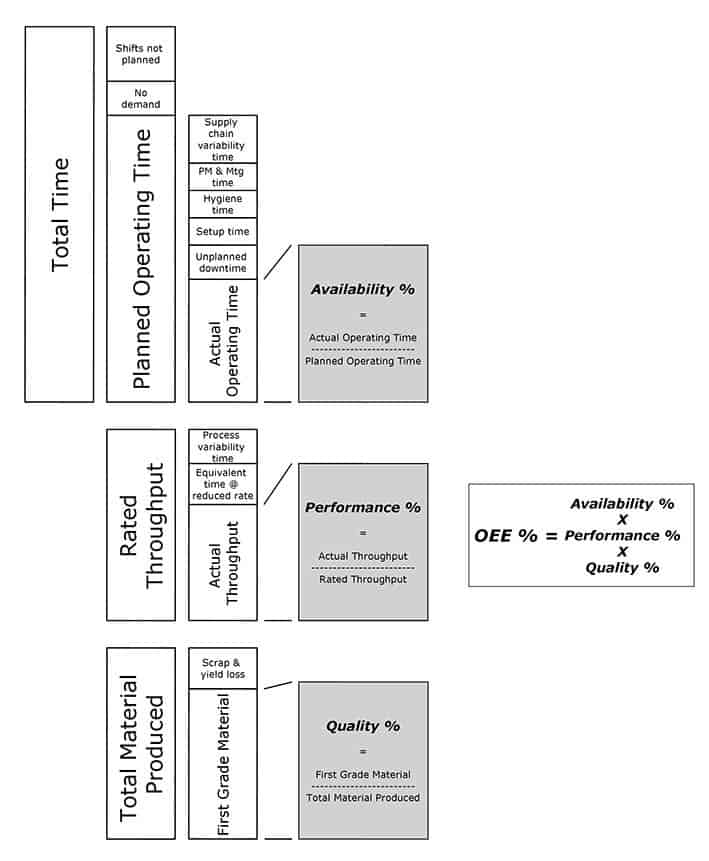
First, we need to deal with a couple of characteristics that are unique to a total factory in the process industry.
- Setups in the process industry involve hygiene as well as physical changeover parts
- All factories are part of a total supply system and so the OEE metric must deal with supply chain variability and factory process variability
So therefore, we need to modify the OEE calculation to encompass these 2 issues as shown below;
Also, the only way that the OEE measure can represent a total factory is if OEE is measured at the bottleneck for the factory.
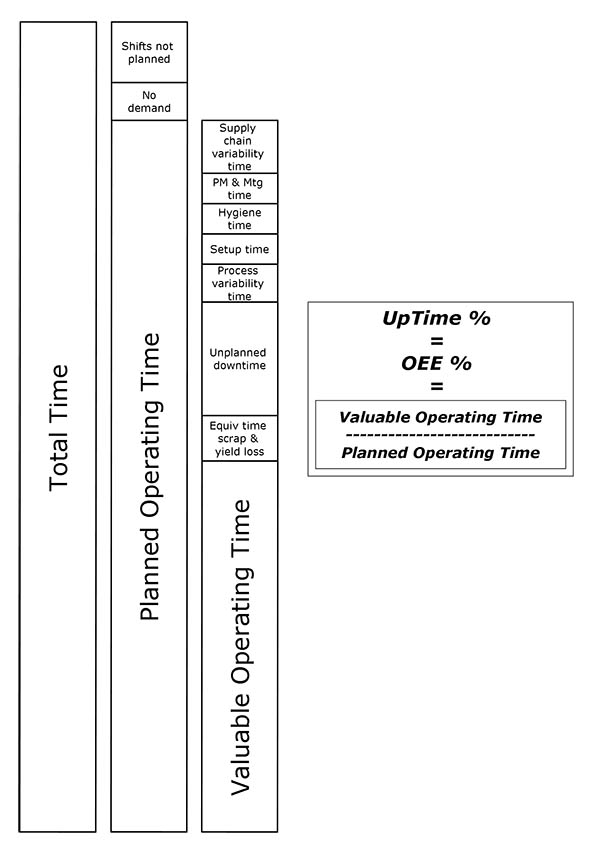
Even if we come up with a way of monitoring the different parts of the OEE measure at the confirmed bottleneck, how do we distinguish between “unplanned downtime” and “equivalent time @ reduced rate”. Well for a complex processng line this is not easy and really doesn’t add much value (for reasons which we will explain below) so for simplicity is would be helpful to combine these measures but this would undermine the Availability and Performance components of the traditional OEE measure.
There is another calculation accepted by the Total Productive Maintenance community called UpTime which gives the same numerical results as OEE for a given line, is easier to understand, includes all the constituents of the OEE measure and allows us to combine “unplanned downtime” and “equivalent time @ reduced rate” into one;
So, why is it helpful to create one total downtime measure for a process or factory in the process industry?
In the process industry workstations are often directly coupled using conveyors, pipework and pumps, hoppers, etc.
In these situations the joint OEE (or UpTime) for a system of directly connected (non-buffered) processes reduces as the number of interconnected processes increases.
The graphic below shows what happens when processes, which by themselves have an independent OEE of say 80%, are connected together without buffering.¹
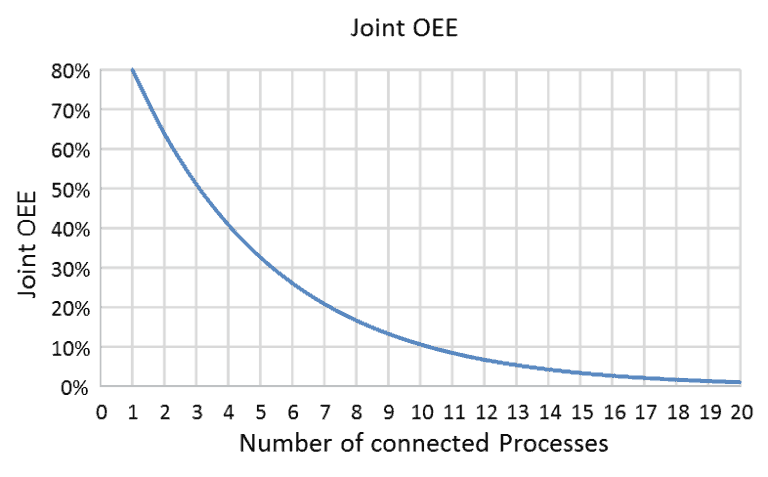 In the process industry it is common to see 5 or more processes interconnected. In these cases, managed buffers (in the form of time (WIP) and capacity buffers) are used to create un-balanced flow lines and this assures joint OOE’s of greater than 40% which is often the only way a high-technology line can be made financially viable.
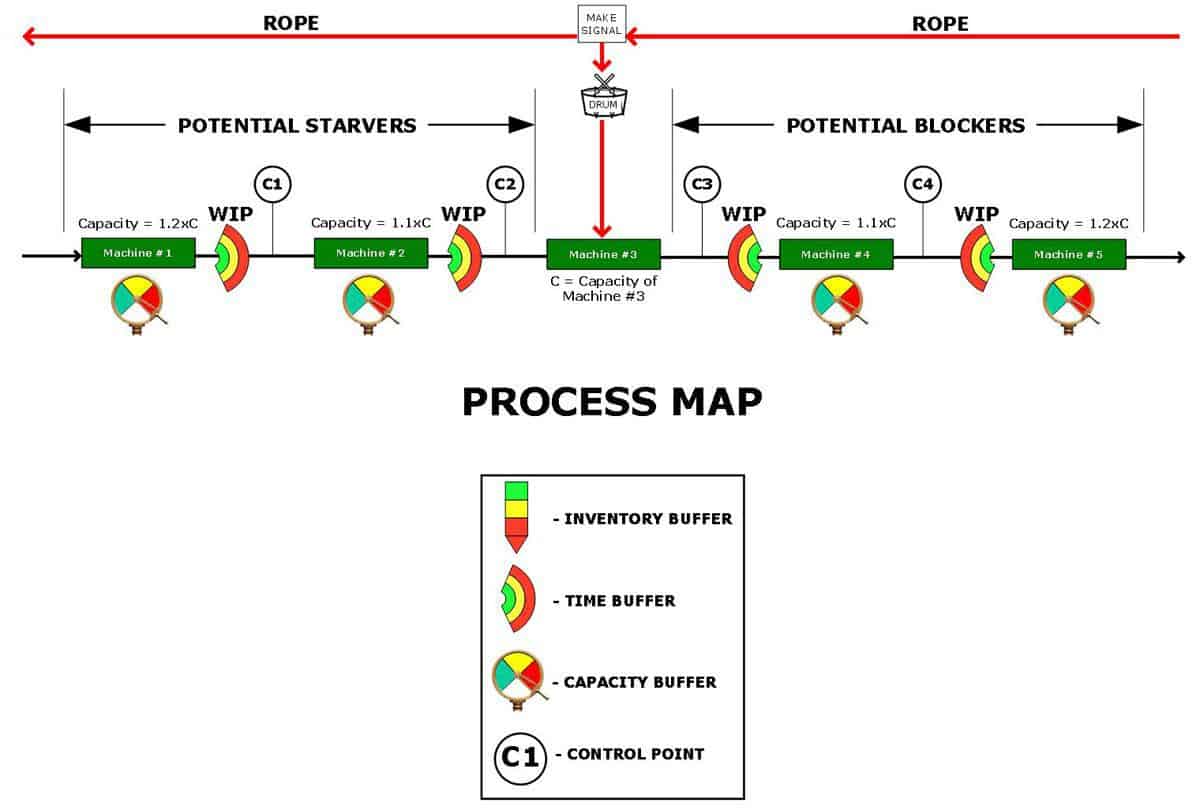
We go into more detail about unbalanced flow lines in our article What is a flow line and how can it be manipulated to maximise performance? For this article it’s enough to say that one of the processes is identified as the “Drum” and buffers are used to ensure that the Drum (i.e. bottleneck or Capacity Constrained Resource (CCR)) doesn’t get starved or blocked. The extent to which this is actually achieved, and therefore the total OEE (or UpTime) maintained at an acceptable level (say > 70%), becomes a function of the statistical interplay of time and capacity buffers on the line.
In these circumstances the OOE’s (or UpTimes) measured at each process or workstation are still helpful for modelling and understanding the behaviour of the whole line at the Drum. However, the difference between “unplanned downtime” and “time @ reduced rate” at the Drum becomes less important and harder to define.
The more useful measure is total unplanned downtime (which can contain elements of reduced rate) which can then be related to the unique, statistical behaviour of the line. This has the added benefit of being very easy to monitor.
Finally, the UpTime metric above is still a bit cumbersome and would be more useful if it was made a bit more granular. Therefore we have introduced the terms Crewed Time, Usable Time, and Utilised Time, see below;

This allows us to establish 5 powerful measures (apart from UpTime) that define the asset performance of a line (remembering that asset performance is the most important measure in the process industry);
Crewed Time (% = Crewed Time/Total Available Time) – Some refer to this as “Lights-on Time”. Its a measure of how much a line or process is required to be available to production to make product. If the Crewed Time is low then the reason for the asset should be questioned. If two lines (capable of making the same products) have a Crewed Time of less than 50% each, then there is an opportunity for asset consolidation. We have seen Crewed Times as low as 8% on lines that are relatively high cost and still being depreciated. Crewed Time (and asset allocation) is the domain of senior plant management and schedulers and has a direct correlation with Return On Assets (ROA).
Usable Time (% = Usable Time/Crewed Time) – Is a measure of how much the line time is tied up in setup, hygiene and preventative maintenance time. It is a function of line design, number of products on the line and line scheduling. Highly technical lines with complex products will have a lower Usable Time when compared to a simpler lines with only basic operational requirements. Also, the Usable Time will be greatly increased by a skilled scheduler that can manipulate the scheduled sequence to minimise total set-ups times (e.g. running sensitive products with allergen claims before moving onto other products with less onerous cleaning and swabbing requirements).
Utilised Time (% = Utilised Time/Usable Time) – The difference between Usable Time and Utilised Time is a measure of total process, line or factory variability. If schedule attainment is measured over a period of say one week (in which say more than 10 different products are run) then this allowance is about half the variability of each run when compared to the average. So, for example, if a line has an average Reliability (see below) of 85% at +/-10% variability for each product then (over a period of a week) the schedule must allow an additional 0.5 * 10% = 5% for additional make up time so that the customer is not short shipped.
Utilisation (see graphic above) – Is a measure of how close the business can schedule a process/factory compared to planned demand and is a function of the historical variation in the supply chain and the process/factory. The variability allowances are larger (and therefore uitlisation lower) for unreliable processes and for supply chains with poor demand forecasts. Initiatives focussing on utilisation should focus on process reliability first before tackling the supply chain. Supply chain variability is best reduced by moving to pull systems rather than relying totally on forecasts (particularly in environments of ever increasing demand volatility). A line/factory with utilisation in excess of 90% should generally be considered out of capacity unless there are robust reliability and pull systems in place.
Reliability (see graphic above) – This is the measure that a maintenance manager should use to assess his or her performance. It is free from crewing, scheduling and utilisation impacts that the maintenance manager cannot influence. We get asked about this a lot so here is some more detail.
The derivation of Reliability for an un-balanced line is related to the extent to which the Drum process is blocked or starved. We have shown the diagram of our basic un-balanced flow line once more below;
We can make the following comments about Reliability for an un-balanced flow line;
- Reliability for a total process/factory is a function of the efficiency of the Drum process and the extent to which the Drum process is starved (by the downtime or slowtime of the upstream processes) or blocked (by the downtime or slowtime of the downstream processes)
- Theoretically, the Reliability of the entire line can simply equal the efficiency of the Drum process (in this case machine #3) if the time and capacity buffers are large enough to absorb upstream and downstream downtime and slowtime.
The extent to which the Drum is impacted by starving and blocking behaviour can be calculated by monitoring the Control Points. For example, if the conveyor at Control Point C2 is empty say 40% of the Utilised Time for a certain product then this helps to isolate the cause of Reliability issues as significant starving problems for this line when running this product. Likewise, if the conveyor at Control Point C3 is full and stopped while the adjacent WIP hopper (time buffer) is also full for say 40% of the Utilised Time then this helps to isolate root cause as significant blocking problems.
Blocking and Starving behaviour on an un-balanced flow line can be quite complex and means that some downtime on the line (depending on where that downtime is located) is much more important that other downtime. This can make tools such as Pareto Diagrams (80-20 rule) less relevant and helpful.
¹ – Taken from Christopher Roser’s site – allaboutlean.com