The process industry (food & beverage, liquids, sheet goods, solid & fluid packaging operations) differs from the parts manufacturing and assembly industry, where the Lean, 6 Sigma and Theory of Constraints methodologies were developed.
Here we list 6 Sigma tools and comment and how they can be applied to the process industry.
Historical Perspective
6 Sigma is a set of tools and techniques introduced by Bill Smith working at Motorola in 1986. Jack Welsh made it central to his business strategy at General Electric in 1995.
Jack Welsh’s 6 Sigma push came just as government funding for Total Quality Management (TQM) research and initiatives were being scaled back. So the vaguely defined quality management approach known as TQM was largely supplanted by the ISO 9000 collection of standards and then the coincident rise in publicity of the 6 Sigma and Lean techniques.
The 6 Sigma tools and techniques share many of the tools, techniques and philosophy contained in TQM which in turn, had beginnings that can be traced back to the work of W. Edwards Demming.
Applicability to the Process Industry
If Lean tools could be described as the common sense waste removal tools of the manufacturing industry then 6 Sigma tools should be described as the technical, variability reduction tools of the manufacturing industry.
6 Sigma tools are all applicable to the process industry largely because variability is at the root of optimising complex supply chains.
There are a couple of weaknesses with generic 6 Sigma initiatives that we see generally and particularly at processing sites;
- The 6 sigma tools address variability very well but they are usually applied in a very confined and narrow business context. This is because prioritising 6 Sigma activities is predominantly an Industrial Engineering or Operations Research activity.
- The makers of packaged 6 Sigma systems try to extend the scope of application beyond factory and product variability and into the realm of the broader supply chain. These attempts often flounder because this would be best achieved by a Lean-6 Sigma-Theory of Constraints-Factory Physics program ……. but that would get complicated …. and that’s why it rarely happens (although that’s where Bullant Creative comes in :-)).
The List
We have used many references for this list but one of the most useful resources was Lean Six Sigma by Michael L. George¹ and we must credit him with a good deal of the foundational content.
| 6 Sigma Tool | What Is It? |
| Affinity Diagram | A way of grouping ideas (usually stemming from brainstorming) into groups based on natural relationships ready for review and analysis. |
| Analysis of Variance (ANOVA) | A technique used to identify which input, or factor, of a process has the biggest effect on output. Usually requires a statistical package to assist in analysis. |
| Benchmarking | The process of comparing business processes and performance metrics to industry bests or best practices from other companies. |
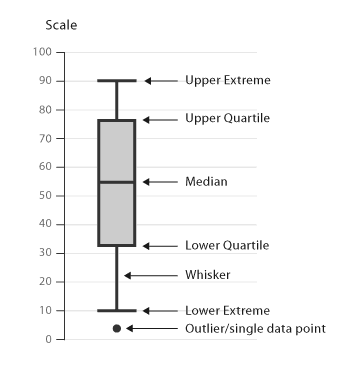
| Box Plots | Standardised way of displaying the distribution of data based on the five number summary: minimum, first quartile, median, third quartile, and maximum (also known as whisker diagram)
|
| Brainstorming | A group creativity technique by which efforts are made to find a conclusion for a specific problem by gathering a list of ideas spontaneously contributed by its members. |
| B’s and C’s/Force Field | Used in problem identification and resolution by stacking all of the driving forces on one side and all of the restraining forces on the other (sometimes show driving forces as Benefits – B’s and restraining forces as Concerns – C’s). Find ways to add to driving forces and remove or lesson restraining forces. |
| Cause and Effect (C&E) Matrices | A method of capturing the Voice of Customer and relating it to process input variables. A way of capturing those critical input variables that effect the process output variables that are important to the customer. |
| Fishbones | A way of organising potential problem solutions into categories known as the 6 M’s: Methods, Manpower (personnel), Machines, Materials, Measurement, and Mother Nature (environment). Information is then displayed on a diagram that looks like a fish skeleton. |
| Checksheets | A simple data recording method used to collect information on the occurrence of certain events within a process. |
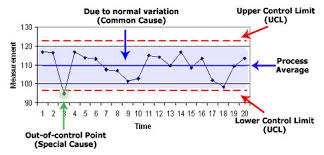
| Control Charts | Graphs used to study how a process changes over time. The charts show;
|
| Cp and Cpk | Indexes of processes capability that show how likely it is that a stable process will deliver good parts given certain upper and lower specification limits. |
| Design of Experiments (DOE) | A very powerful tool used for improving yield by reducing variation. Its an entire body of knowledge around how to manipulate process factors to discover the combination that is most effective, efficient and robust in actual operating conditions. There are many variations of DOE. |
| Define, Measure, Analyse, Improve, Control (DMAIC) | The most widely used improvement model used for 6 sigma implementations:
The DMAIC model is often supported by using a series of tollgate reviews that ensure appropriate governance. |
| Failure Mode and Effects Analysis (FMEA) | A tool used to focus attention on the prioritise potential failure risks for a process. FMEA generally includes three scores which are multiplied together to arrive at a total risk rating; – Likelihood that something will go wrong – Detectability of the failure – Severity of the failure |
| Gage Repeatability and Reproducibility (R&R) | A method by which physical measurement processes are studied and adjusted to improve their reliability. – Repeatability means that someone taking the same measurement on the same item with the same instrument will get the same answer. – Reproducibility means that different people measuring the same item with the same instrument will get the same answer. |
| Gantt Charts | A type of bar chart that illustrates a project schedule. Gantt charts illustrate the start and finish dates of the task and summary elements of a project. |
| Histograms | A graphical display of data using bars of different heights. A histogram groups numbers into ranges and is particularly useful when displaying the shape of a distribution involving a large number of observations. |
| Hypothesis Testing | A hypothesis test calculates the probability, p, that an observed difference between two or more data samples can be explained by random chance alone, as opposed to any fundamental difference between the underlying populations that the samples came from. So hypothesis testing answers the question, what is the probability that these data samples actually came from the same underlying population? |
| Multi-Vari | Multi-vari analysis is a technique for viewing multiple sources of process variation. Different sources of variation are categorized into families of related causes and quantified to reveal the largest causes. For example, instead of telling you just that a particular shift is a factor and a machine is a factor, multi-vari analysis provides a breakdown for you to say, for example, that machine B on shift 1 is causing the most variation. It won’t quantify the variation…just show you where it is. |
| Net Present Value (NPV) / Internal Rate of Return (IRR) / Discounted Cash Flow (DCF) Analysis | Discounted Cash Flow (DCF) analysis is carried out by investment managers to establish the financial merit or a particular project. The two most widely used techniques for a DCF analysis are Net Present Value (NPV) and Internal Rate of Return (IRR). NPV and IRR compare cash outflows and cash inflows with a nominal expectation of how the value of money will appreciate over time. |
| Pareto Charts | A bar chart in which each bar represents the relative contribution of each cause or component to the total problem, with bars arranged in descending order of importance. The Pareto 80/20 principle asserts that 80% of the problem can be explained by just 20% of the causes. |
| Process Decision Program Charts (PDPC) | The Process Decision Program Chart (PDPC) provides a systematic exploration of a process and what could go wrong. There are 4 steps to creating a PDPC:
|
| Program Evaluation and Review Technique (Pert) and Critical Path Method (CPM) | Pert and CPM are both project modelling techniques. CPM calculates the longest path of planned activities to the end of a project. The term critical path has been attributed to the developers of Pert at the U.S. navy. Pert is a statistical tool used in project management which is designed to analyse and represent the tasks involved in completing a given project. Pert is often mistaken as just the Pert network diagram which is just an output from the technique, not the technique itself. |
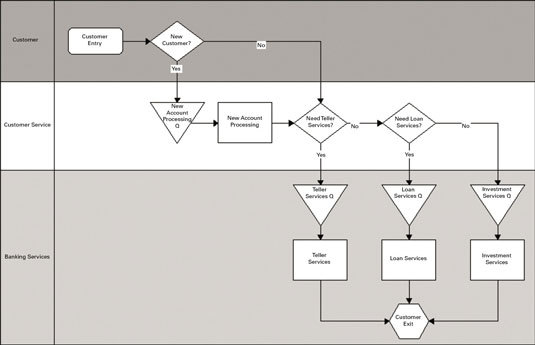
| Process Mapping | A process map is a flowchart that clearly illustrates the steps making up a process, the inputs necessary to carry out each step, and the outputs resulting from each step. The map can include standard representations for each activity (such as a rectangular box for a process, a diamond for a decision, etc). Also “swim lanes” to represent cross functional boundaries. Data on the process map can include:
|
| Regression | Regression analysis is a statistical process for estimating the relationships between variables.Many techniques for carrying out regression analysis have been developed including linear regression, ordinary least squares regression, polynomial regression, etc. |
| Run Charts | A run chart, also known as a run-sequence plot, is a graph that displays observed data in a time sequence. Often used as the foundation chart for a Control Chart. |
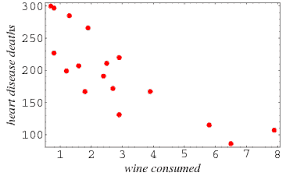
| Scatter Diagrams | A scatter diagram, scatter plot, or scatter graph isused to display values for typically two variables for a set of data. The data is displayed as a collection of points, each having the value of one variable determining the position on the horizontal axis and the value of the other variable determining the position on the vertical axis.
|
| Supplier Input Process Output Customer (SIPOC) Tool | SIPOC is a high-level overview of a process that depicts how the given process is servicing the customer. It stands for:
|
| Tree Diagrams | A chart that begins with one central item and then branches into more and keeps branching until the line of inquiry begun with the central item is exhausted. See Process, Decision, Program Charts (PDPC) above. |
| Voting Techniques | Used in conjunction with brainstorming, ideas are culled to a manageable level and then a vote takes place.
|
¹ Lean Six Sigma – Combining Six Sigma quality with Lean speed. Michael L. George, McGraw-Hill (2002)