
Ever wish that there were simple, fundamental building blocks that could be used to represent your supply chain, no matter its complexity?
Hidden in the industrial engineering literature are 10 building blocks that can be used to clearly establish the performance of an entire supply chain.
When we think of complex supply chains we often think of terms such as bullwhip effect, advanced planning & optimisation, sales and operations planning, Lean, Six Sigma, the list goes on.
When all the layers are peeled back however, there exists a basic framework that underpins every supply chain and forms the basis on which we can
- link the different parts and functions of a business
- link the flow of products, materials and resources to the profitability of a business
- identify bottlenecks that are hindering the profitable flow of products
There are 4 primitive building blocks, that is to say fundamental elements that exist in all supply chains.
Building Block #1 – Demand
A customer’s desire and willingness to pay a price for a specific good.
Building Block #2 – Transformation
The act of changing materials, or other resources, into goods in order to meet demand.
Building Block #3 – Stocks
Materials, resources or finished products waiting for transformation or demand.
Building Block # 4 – Flow
Materials, resources or finished products moving to, through or from transformation processes or stocks
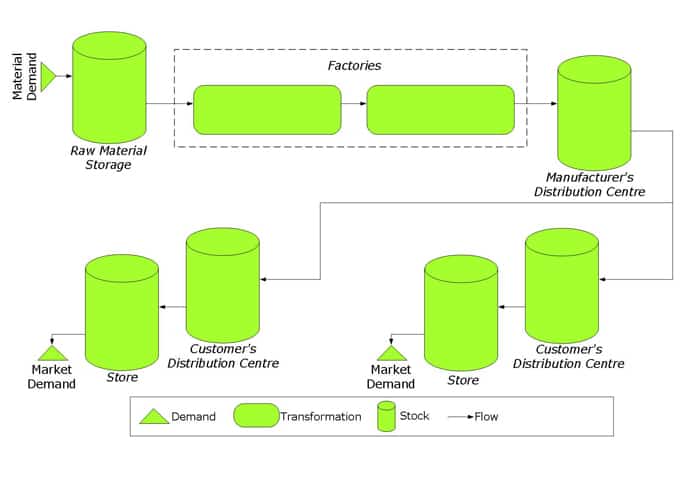
These building blocks can be connected together to represent a supply chain. Here we have a simple retail supply chain.
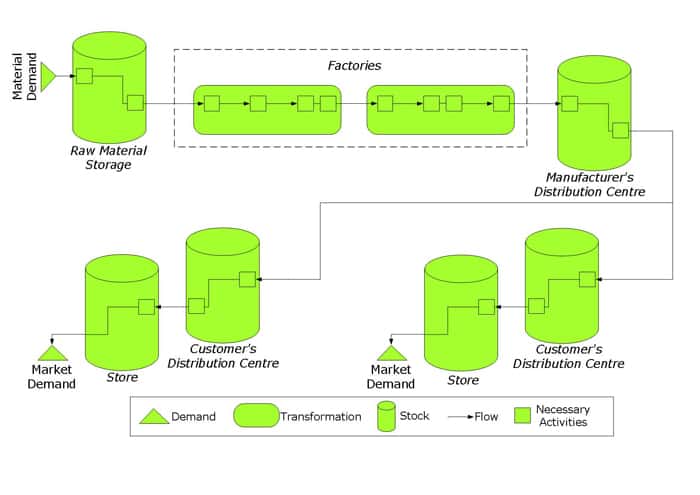
Each transformation process can be split into any number of necessary activities. Stock locations are usually warehouses which include a number of unloading, putaway, picking and loading activities. This brings us to our next building block;
Building Block #5 – Necessary Activities
Necessary activities can be fully manual through to fully automatic stand-alone activitities. These activities can be necessary but non-value adding OR necessary and value adding. In any case they are recognised as necessary activities within the supply chain.
This would be a good and helpful model if demand and transformation behaved in a deterministic way. That is to say, this model would be helpful if we could perfectly predict when a customer wants product and know that factories and resources could transform product with a reliability of 100%. In this case stocks could be restricted to only those required to fulfill particular customer sequencing needs.
However, the real world says either;
- perfection is impossible, or
- if perfection where possible it would be impossibly expensive
So, in order to satisfy variable demand using imperfect transformation processes, shock absorbers (or buffers) must be introduced into the system. These behave just like shock absorbers on a car, adjusting to sudden and unanticipated shocks from the road terrain so as to keep the driver safe. In this case we are keeping the customer safe from the uncertainties and shocks that occur in our supply chain.
There are ONLY 3 types of buffers that can be inserted into a supply chain.
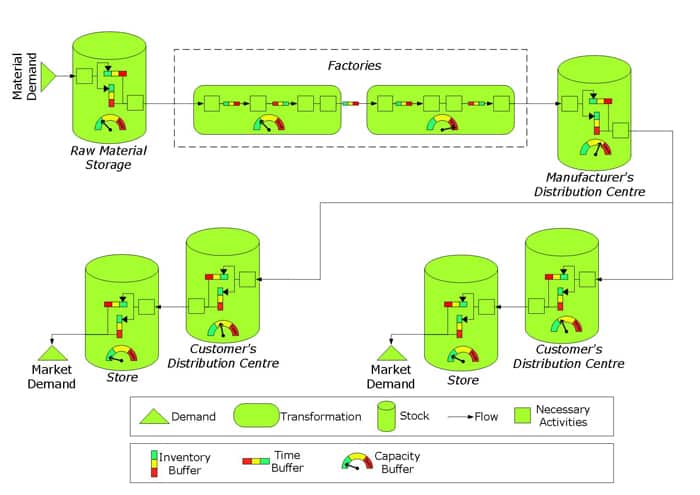
Building Block #6 – Inventory Buffer
Extra material between transformation processes or between transformation processes and demand.
Building Block #7 – Time Buffer
Early arrival of material or resources before necessary activities, before transformation processes or before demand.
Building Block #8 – Capacity Buffer
Extra transformation potential needed to satisfy irregular or unpredictable demand rates, otherwise known as “sprint capacity”.
There is more information on buffers in the article Buffers! the secret behind exceptional supply chain performance.
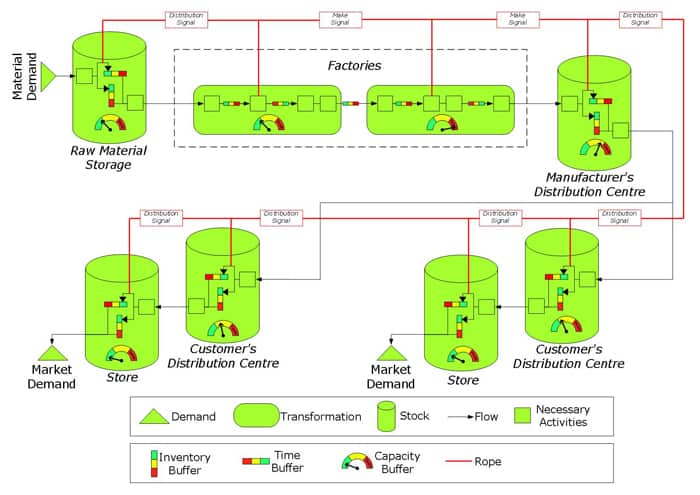
Building Block #9 – Rope
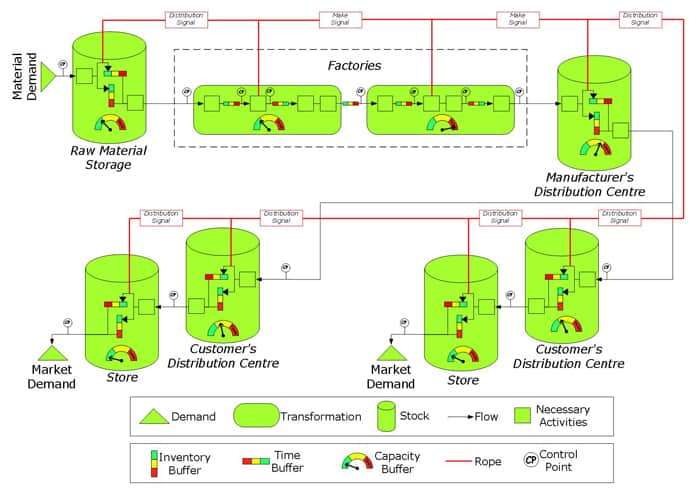
We use a Theory of Constraints term, “Rope” to represent the gating mechanism used to manage make and distribution signals within a supply chain.
These building blocks can be used to represent a supply chain and its not to hard to think of a way we could animate this conceptual framework. We could use colour coded meters and gauges to represent flow, the depletion of stocks and the flexing of buffers. This would create a compelling show and mesmerise us as we witnessed a complex adaptive system in motion.
The performance of the system could be measured by how frequently different buffers got to dangerous levels. This would be helpful but it would fail to do two things;
- identify when we miss supply obligations completely
- identify specific bottlenecks that cause supply disruptions
To do this a final piece of the puzzle must be introduced;
Building Block #10 – The Control Point
Control points are placed after time buffers or inventory buffers. They measure the frequency with which products, materials or resources were unavailable at crucial points within a supply chain even with the effective design and strategic placement of buffers.
These building blocks can be used to represent any supply chain. Why is this helpful?
- These 10 building blocks are the essential elements of our tailor-made Value Stream Maps for the process industry. They provide a means by which planned structural modifications to a supply chain can be represented; communicating the impacts on flow by using a current state map and a future state map. When combined with financial data, showing total-cost-to-serve, this provides a more comprehensive view of supply chain improvement proposals.
- The building blocks provide a skeleton on which the flesh of data can be hung. We can choose to introduce data to all the building blocks or we can take a more forensic approach, using data to confirm our perception of how we think the supply chain is operating at a specific area.
- Together the building blocks provide a systemic view of the supply chain. For example, while minimising the size of all the buffers is important (i.e. Lean), its important that buffer sizes are only reduced with an understanding of how the changes will impact the rest of the system.